The 10T Run Up Is Probably About Done
Last Week This Morning
- 10 Year Treasury continues to climb, closing out the week at 1.34%
- German bund up just as much to close out at -0.31%
- 2 Year Treasury down 1bp to 0.10%
- LIBOR at 0.12%
- SOFR is 0.03%
- Senate Majority Leader Chuck Schumer said he expects the COVID rescue package to be signed before March 14, when current enhanced unemployment benefits are set to expire
- Markets are increasingly worried about inflation, while the Fed reiterates the opposite and a commitment to remain accommodative in perpetuity
- Texas should have known better than to put Bill O’Brien in charge of the power grid
- I spoke with several people in Texas last week and it’s bad. No water. Many without electricity. Hopefully one of my favorite places to visit can bounce back this week.
10 Year Treasury
On October 26th, we wrote that Treasury supply, not economic growth, would cause a spike in yields.1
The Democrats surprisingly won two GA Senate seats early January and next thing you know, we’re talking about a $1.9T recovery package on top of the $900B package passed in December. How do you pay for all that? Treasury issuance – credit and forget it!
Check out how dramatically market expectations for the 10 Year Treasury in the future have changed since that election.

Are we off to the races? Is 2.00% on the horizon? In a Bloomberg article this week, one economist believes so.2
Before the pandemic, the 10-year yield was trading at about 1.6%, and if we are going to get back to what the economic situation was — give or take — back then, then there’s no reason why yields should be lower than that,” said Stephen Stanley, chief economist at Amherst Pierpont Securities.
He forecasts the 10-year yield will end the year at 2% — a level last seen in August 2019 — up from the almost one-year high of 1.36% reached this week.
Based on feedback to last week’s inflation newsletter, most readers agree with that economist and weren’t shy about telling me why I’m wrong.
I know there’s growing consensus that rates are going to keep climbing. But if I’m willing to write a newsletter saying inflation fears are overblown, surely I can take a contrarian view on yields as well.
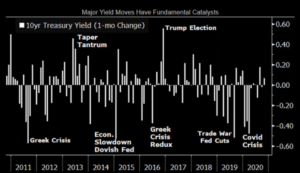
In the October newsletter I referenced at the beginning, I included this chart Bloomberg put together that highlighted extreme rate movement catalysts. When rates fall, it’s the typical economic contraction message. But when rates spike, it’s over Treasury supply concerns, not growth.
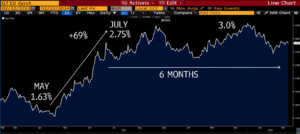
Let’s review the two most dramatic spikes since the financial crisis – the infamous 2013 Taper Tantrum and the 2016 election.
2013 Taper Tantrum
This was the doozy. The 10 Year Treasury was up more than a point in less than two months. It was pandemonium.
On a relative basis, the 10T was up 69%. It was then rangebound for the next six months with some typical ups and downs along the way.
2016 Election
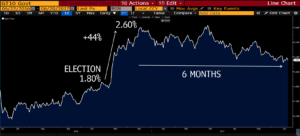
The Trump election caused inflation expectations to spike, dragging yields up with them. The 10 Year Treasury yield was up 0.80% in about a month.
On a relative basis, the 10T jumped 44%. It was then rangebound for the next six months.
Can you guess where this is heading?
Today
The 10T is up 0.43% since that January 4th.
- Another 40bps to 1.75%, and we replicate 2016
- Another 70bps to 2.00%, and we replicate 2013
Both seem entirely plausible.
Except…when you consider on a relative basis, we’ve already seen a spike of 47% on the 10T.
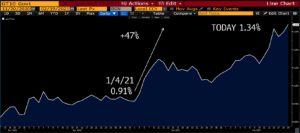
The move since January 4th is already bigger on a relative basis than we saw after Trump won in 2016.
Let’s say we replicate the Taper Tantrum move – just 1.50% on the 10T.
In other words, a run up above 1.50% would be nearly unprecedented.
When you look at how far rates have climbed since the July 31st bottom of 0.50%, it becomes tougher and tougher to envision further spikes from here.
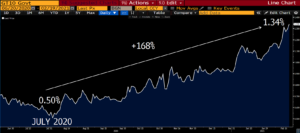
The recent spike in yields is pricing in the full $1.9T COVID recovery package plus a very smooth vaccine rollout. What if we encounter a single hiccup?
The biggest risk to higher yields right now is not economic growth – that’s already priced in.
It’s tapering.
Jay Money Powell knows this, and he is going to handle this topic more delicately than the Eagles front office handled Carson Wentz. He might end up with similarly disastrous results.
Here’s the Fed’s balance sheet since the financial crisis. There is a less than 0% chance the Fed can ever return to pre-2010 levels. I don’t think we’ll ever get back to $4.5T in my lifetime. This is the new normal.
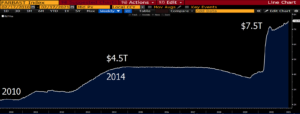
You’re worried about China? They aren’t even the second biggest holder of Treasurys.3 Who can move markets when the Fed’s holdings are 7x larger?

What happens if the biggest buyer of Treasurys in the world stops buying? What happens when they even start talking about stopping buying?
That’s the risk to a 2.00% 10T, not an economic recovery.
Bottom line – I think the 10T run up is largely done, with a short-term peak of around 1.50%. I think it’s more likely that we are range-bound for the next six months than that we test 2.00% or 1.00%.
I can already hear the brokers rolling up their sleeves so they can type angrily explaining why rates are going much higher and borrowers should refi now. Because I love you as much as Ted Cruz loves his daughters, I will help you out.
About three years ago, I wondered aloud if 3.05% was the new floor in the 10T.4 It wasn’t. Rates promptly collapsed. Send this to your borrowers as Exhibit A about why they should ignore me.
Week Ahead
Far more economic data this week, headlined by Friday’s Core PCE (Fed’s preferred measure of inflation). GDP, durable goods, consumer spending, etc. Our economic data cup runneth over.
Sources
- https://www.pensford.com/strong-gdp-wont-cause-rates-to-spike-but-treasury-supply-could/
- https://www.bloomberg.com/news/articles/2021-02-20/the-runway-toward-higher-treasury-yields-looks-free-and-clear
- https://ticdata.treasury.gov/Publish/mfh.txt?source=content_type%3Areact%7Cfirst_level_url%3Aarticle%7Csection%3Amain_content%7Cbutton%3Abody_link


