Net Shorts on 10yr Rates Hit All-Time High
Last Week This Morning
- The 10T jumped Friday to 2.93% following the job report
- German bund up 4bps to 0.38%
- 2 year Treasury up 6bps to 2.69% (bad news for cap pricing)
- LIBOR at 2.13%
- LIBOR started climbing and will continue to do so as we approach the Sept 26th FOMC meeting where the market has a 95% probability of a hike priced in
- SOFR at 1.94%
- Economy added 201k jobs last month, the 95th consecutive month of job gains
- Unemployment rate came in at 3.9% even though the participation rate dropped
- Average hourly earnings hit 2.9%, highest since 2009
- Trump said on Wednesday he would be fine with a government shut in order to secure funding for the wall, “If it happens, it happens.”
- Current funding expires at the end of the month
- The Atlanta Fed GDPNow forecast projects 4.4% GDP in Q3
- Market now has odds of a December rate hike at 63% (LIBOR would be around 2.60%)
- ISM Manufacturing hit 61.3, the highest since 2004
Jobs
Average hourly earnings were stronger than an Eagles goal line stand against the Falcons, coming in at 2.9% – the strongest growth since June 2009. Here’s a graph from the failing NYT’s Ben Casselman. Slow and steady upward pressure since the trough in 2012-2013.
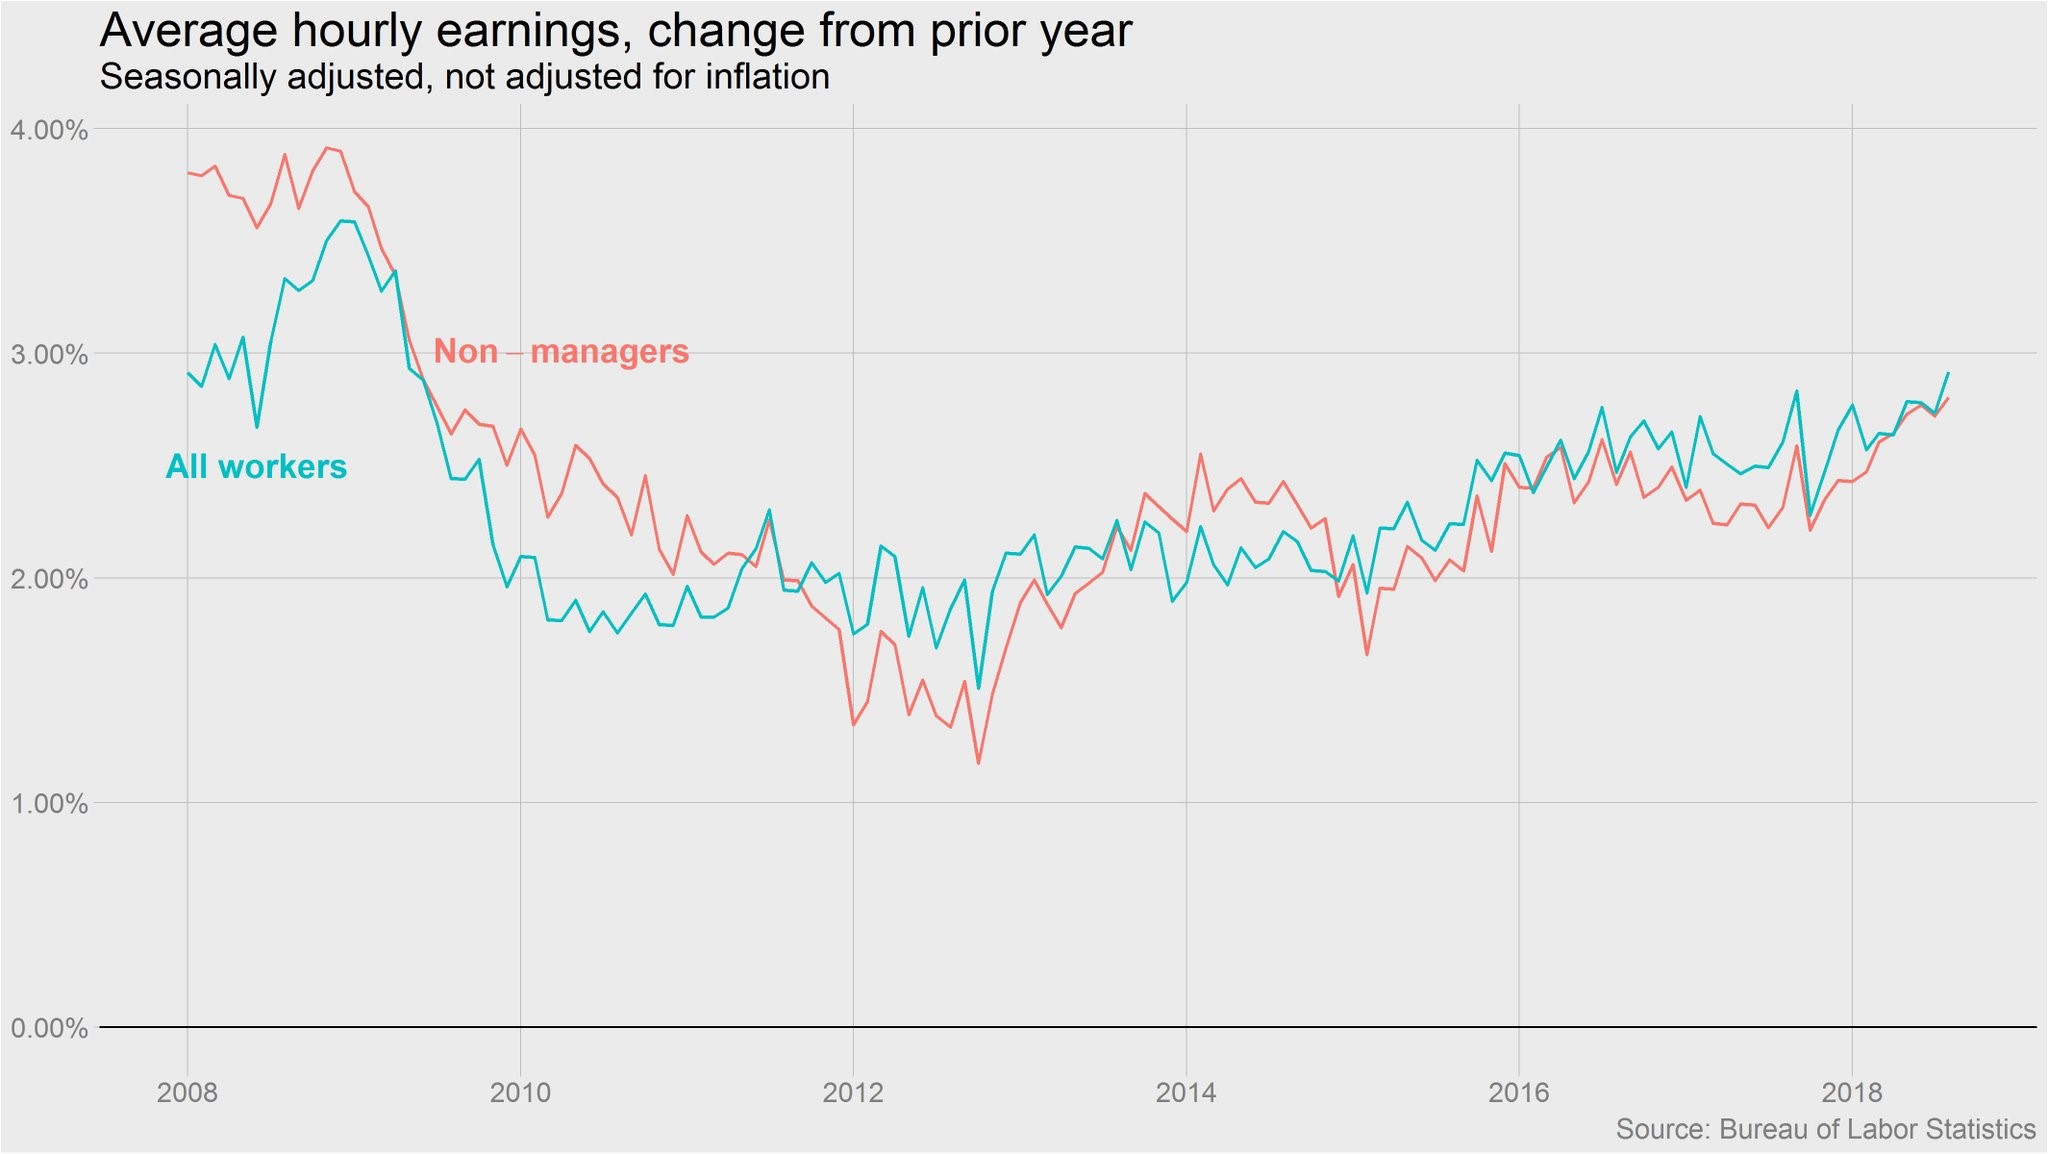
This wage pop increases the odds of another rate hike in December, but keep in mind that average hourly earnings is an extremely volatile data series and we shouldn’t assume it will continue to steadily climb.
Despite the downward revisions to the last two reports by a net 50k, the three month average gain is still 185k, well above the Fed’s break even estimate of 100k. The August print has been revised upward by an average of 51k over the last five years, so this number could look even better in a month.
Other highlights:
– underemployment rate fell to 7.4%, a 17 year low
– participation rate fell from 62.9% to 62.7%
– # of involuntary workers fell to 2007 levels
– over the last six months, 781k part time workers have found full time jobs
– 1.3mm unemployed have been searching for at least 27 weeks
– manufacturing actually lost 3k jobs
A sub-4.% unemployment rate is rarefied air. There’s only been a couple of instances over the last 70 years where the unemployment rate started with a 3, and only one time when it started with a 2 (post WWII).
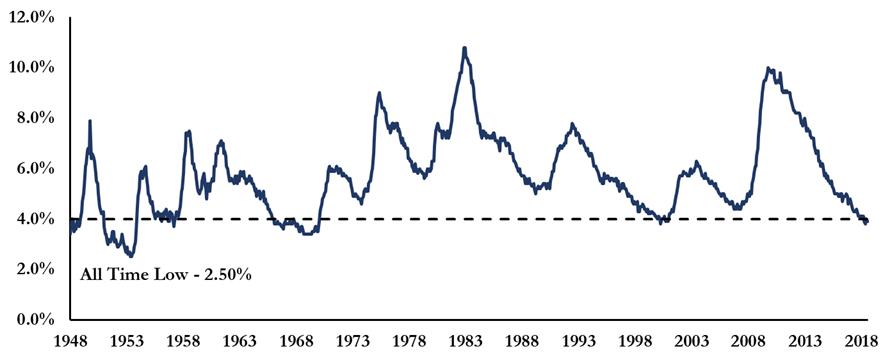
Historically low unemployment, yet lagging wages and inflationary pressures. No wonder the Fed is confused.
10 Year Treasury Yield
We decided to take a look at the relationship between the Unemployment Rate and the 10 Year Treasury yields. Intuitively, they should be inversely related.
Below is a graph that represents the 10T yield minus the UR. For example, if the 10T is 5.0% and the UR is 4.0%, the spread would be + 1.00%.
10 Year Treasury Minus Unemployment Rate
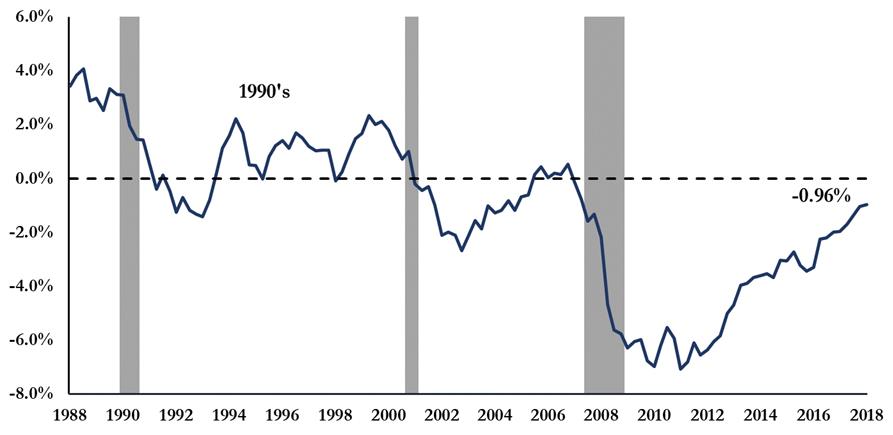
As the unemployment rate has fallen steadily during the recovery, the spread has gone from deeply negative to just 0.96% negative.
With the UR already at 3.9%, it stands to reason that if this trend continues, it will be driven by yields moving higher. Perhaps the UR can get down to 3.5% or maybe even 3.3%, but probably not 2.5%. That means there’s maybe another 0.50% of compression in this spread from just the UR.
During economic expansions, this spread turns to turn positive. Even if the UR drops to 3.4%, that would imply the 10T would need to move at least 0.50% higher from current levels.
Interesting…and eerily reminiscent of the 10T vs GDP study we did a few months ago.
Nominal GDP vs 10 Year Treasury
Nominal GDP (which accounts for inflation) and the 10 Year Treasury yield have a remarkably high correlation.
Since 1962, the average spread between these two has averaged just 0.33%.
Today, this spread is 2.50%.
Nominal GDP vs 10 Year Treasury Yield
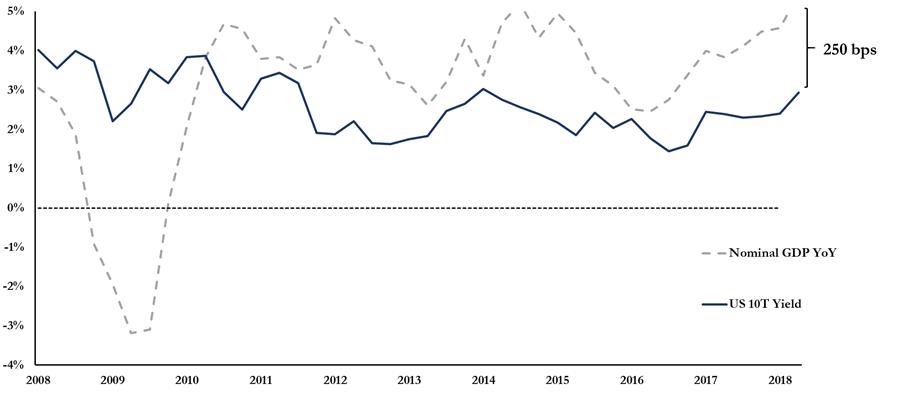
The takeaway from this graph is that there could be t 2.17% (2.50% – 0.33%) of upward pressure on 10T yields if,
– GDP stays at current levels
– this relationship reverts to the mean
Obviously, QE has distorted this relationship. But with the Fed normalizing the balance sheet, it does suggest some upward pressure on rates.
Loyal readers my rightly point out that we’ve highlighted the probability of declining GDP in the coming years. Just last week we highlighted that consensus forecasts call for GDP to decline to 1.9% by the end of 2020.
For illustration purposes, let’s assume GDP drops by 2.0% – a substantial decline. That would still imply a 0.17% increase in Treasury yields.
But what if GDP just drops back down to 3.0%? That would imply more than a full point of upward pressure on long term fixed rates.
The federal deficit will increase from $825bn (4.1% of GDP) to $1,250bn (5.5% of GDP) by 2021. Think about how much Treasury issuance it will take to fund that gap in the coming years…how to rates not move higher?
I’ve been so dovish on rates for so long that it feels awkward to be worried about higher rates…but we aren’t the only ones. Traders are shorting 10yr rates at all-time highs and loaded up last week. According to a Bloomberg article, one trader made $10mm on Friday after the jobs report.
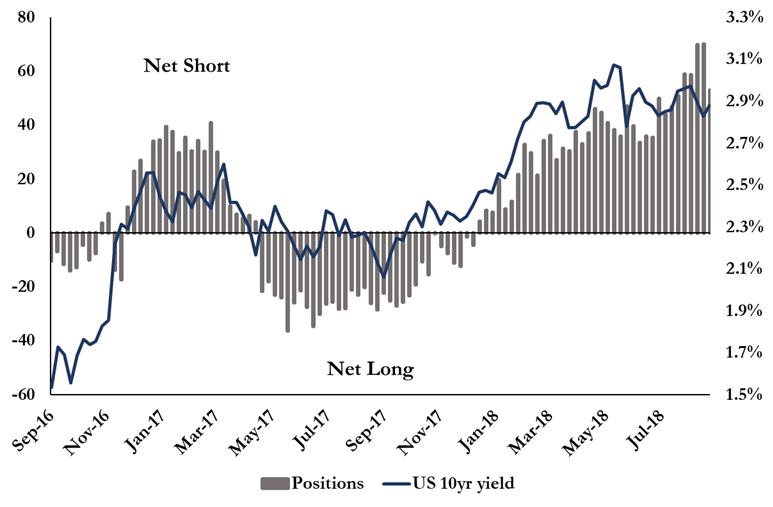
It will be interesting to see if these shorts cover their position in the coming weeks with yields at high enough levels they can close out positions with a nice profit. Plus, breaking through 3.0% will require some collective market conviction.
But absent bad news (particularly tariffs/trade war fears), the bias is for higher rates.
Paradoxically, it may the Fed tightening cycle that is keeping a lid on the long end of the curve. The curve tends to flatten as the Fed hikes. If job reports, inflationary data, etc continue to come in strongly, the Fed may be able to hike more aggressively (or at least not send dovish signals).
But if the Fed starts sending signals about a slower pace of hikes, especially once we approach the new neutral rate, the yield curve may steepen on the relief the Fed isn’t hiking us into a recession.
Obviously, it would also help if the rest of the world wasn’t still grappling with 0% interest rates. It’s tough for UST yields to climb dramatically when the alternative is to stick your money under a mattress.
Goldman Bull/Bear Market Risk Indicator
Goldman created an index last year to measure likelihood of a bear market. It’s gaining some attention lately because, as Goldman said last week, “Our Bull/Bear market indicator is flashing red.”
It’s now predicting a 75% probability of a bear market, 10% higher than the same time last year. It’s also at a level higher than the level experienced pre-crisis.
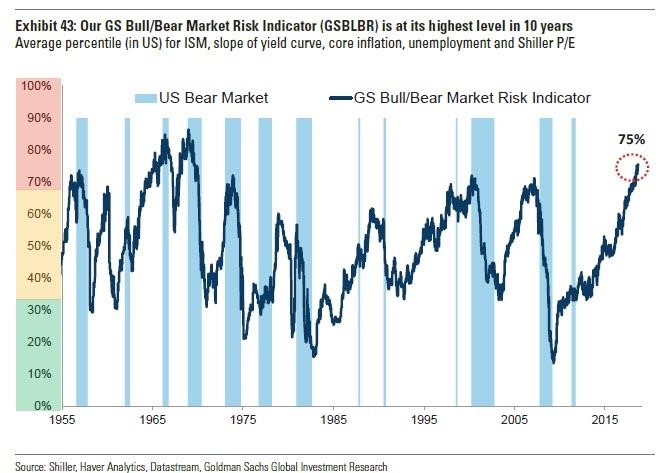
GS is not calling for a sharp correction a la 2008, but more like a slow grind lower on equity returns. In particular, Goldman cites extreme PE ratios (95% percentile) as a warning sign.
Before we all panic and sell right into the welcoming arms of a GS equity trader, please note GS only puts a 10% probability of a recession next year and 20% within the next two years.
Perhaps more importantly, the report highlights the limitations central banks will encounter during the next downturn, “the combination of constrained fiscal policy headroom in the US and limited room to cut interest rates in Japan and Europe may well dampen the ability to generate a strong coordinated policy response to any downturn, and also make it harder to get out of such a downturn.”
This Week
Inflationary data and beige book will be the data headliners, but the ECB is also on tap with a speech by Draghi.


