10 Year Treasury – The Seven Year Itch
I wish the Weather Channel meteorologists announced themselves like and NFL team before a Monday Night Football game.
Jen Carfagno, “AMHQ Host, Penn State University”.
Reynolds Wolf, “AMHQ Weekend, Mississippi State University”.
Stephanie Abrams, “Meteorologist, Florida State Jameis Winstons”.
Dr Greg Postel, “Hurricane Specialist, Princeton High Tigers.”
Jim Cantore lifts his head up to stare directly into the camera…”Jim Cantore…THE Lyndon State College.”
Good luck to everyone effected by the flooding. The little creek in our backyard turned into a river over the weekend. It never raised to a level that threatened the house, but it was a small taste of the powerlessness those more directly impacted must have felt. You are in our thoughts and prayers.
Last Week This Morning
- The 10T broke 3.00% for the first time since my infamous “3.05% is the new floor” newsletter
- German bund up 7bps to 0.45%
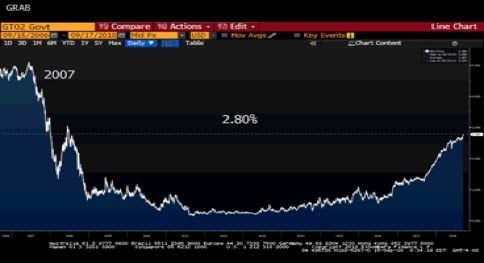
- 2 year Treasury up 10bps to 2.79% (highest in a decade)
- LIBOR at 2.16%
- LIBOR started climbing and will continue to do so as we approach the Sept 26th FOMC meeting where the market has a 95% probability of a hike priced in
- SOFR at 1.94%
- CPI missed expectations, with Core CPI coming in at 2.2% vs 2.4% forecasted
- Odds of a December hike now 80%
10 Year Treasury – 3.0% Threshold Analysis
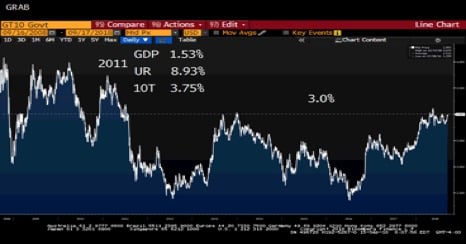
Last week’s newsletter focused on the fact that net shorts on 10yr rates hit an all-time high…and then the T10 hit 3.00% Friday. Coincidence? Happenstance? I think not.
This suggests the market bias for higher rates is stronger than the BCS committee fanboy love affair with Ohio State. This has been a common theme during the Trump WH, where overall business optimism, deregulation, and inflationary policies lead to rising rates…until a tweet says the US will tariff China into oblivion. It’s a classic two steps forward, one step back routine.
As rates touch key benchmarks, like 3.00%, the question becomes – will traders close their positions and take profits? Or let it ride and see if they can catch a wave of rate movement through the next key threshold?
In the near term (again, absent bad news), traders have enough cushion between current levels and the downside key support level (2.82%-ish) that they may be comfortable holding onto the shorts to see if the T10 is finally poised to make a big move.
It’s important to note how critical the 3.0% level on the T10 really is – it has largely held for seven years. If you hired an analyst out of college this year, they probably couldn’t drive a car the last time the T10 spent more than a week above 3.0%. If you have a kindergartner…they weren’t even born yet!
More importantly, the economy was materially weaker than it is today. We were only three years removed from the worst financial crisis since the Great Depression. Greece was experiencing its first debt crisis and we all worried that the eurozone could collapse. The US credit rating was downgraded below AAA for the first time ever. The unemployment rate was above 9% for much of the year…and the T10 peaked at 3.75%.

Traders could be holding on to shorts to profit off the first real breach at 3.0% in seven years. Who wants to miss out on that trade? Then close out at 3.25% and go into defensive mode through year end to protect the P&L (and annual bonus).
It seems hard to justify a sub-3.00% 10 year Treasury with a 3.9% unemployment rate, a 4% GDP, and Fed Funds moving towards 3.0%, right?
Right?
Right?
I’ve given up trying to figure out what it will take for the 10yr Treasury to move to 3.25%, but it just feels like a sub-3.0% yield is too low, doesn’t it? If the 10yr Treasury breaks and holds above 3.0%, the move to 3.25% could be quick.
Flattening Yield Curve
Everyone can list off the reasons why the 10yr Treasury is struggling to push higher, but one commonly overlooked explanation is the Fed tightening cycle. The yield curve always flattens during a tightening cycle. If we hold the 2 year Treasury yield constant, it is challenging for the 10yr to move higher as the market fears an overly aggressive FOMC.
When the 2yr pushes higher, like it did last week, the 10yr can move higher in sync without the steepness of the yield curve changing. The 2yr is now at a decade high. Unless the Fed ramps up talk of additional hikes, it may struggle to move materially higher.

With that in mind, what typically dictates the 2 year Treasury? Fed monetary policy.
The market is pricing in LIBOR at 3.00% by the end of 2019. That’s three more hikes after the Fed hikes on September 26th. Depending on Fed-speak, the 2yr Treasury could gradually move towards 3.00%, flattening the yield curve further.
In other words, the 2yr Treasury probably doesn’t have a ton of room to move higher, which in turn could restrain the upward pressure on the 10yr Treasury…until the Fed signals the end of the tightening cycle. The market won’t wait for the last rate hike to push 10yr yields higher, it just needs some sort of signal from the Fed that it will stop hiking at some point. Until then, there’s a threat of the Fed over-hiking, inverting the yield curve, and pushing us into a recession.
Other reasons the yield curve could continue to flatten through year end:
– Fed projections put Fed Funds ultimately at 3.25%, which the market believes is unlikely but can’t completely write off. As long as Powell is talking about rate hikes, the front end of the curve will experience upward pressure and the curve could flatten.
– trade fears, geopolitical risks, near 0% global rates, fading fiscal policy impact, etc.
– tax cuts and repatriation of overseas cash has reduced demand for short/intermediate Treasurys, which should apply upward pressure on the front end
– Q2 corporate earnings release show about $85B of bond selling with tenors 1-5yrs, again applying upward pressure on the front end
– Current 2yr and 3yr Treasury auction sizes are projected to be up 30%, but the long end is only increasing by 8-10%. Front end up, long end not up by as much = flattening.
– Balance sheet normalization has more roll-offs on the front end than the long end. Front end up, long end not up by as much = flattening.
– Probability of Democrats winning the House in November and grinding policy changes to a halt
A flattening curve would be painful for the short position holders mentioned above. While the market is short across the curve, it is shorter on the long end. That translates into even more pain if the curve flattens. It’s possible that the shorts are effectively betting that the Fed won’t ramp up rate talk hikes and are trying to get out ahead of the end of the tightening cycle.
While we keep waiting for long term rates to move higher, just keep in mind there are a lot of technical factors tied to Fed policy helping to keep the yield curve flat.
Fed Speak on the Yield Curve – Nothing to Worry About
“I would expect in any tightening cycle like this to see some flattening of the yield curve, so I don’t think that’s particularly extraordinary…If that [dual mandate] were to require us to move interest rates up to the point where the yield curve was flat or inverted, that would not be something I would find worrisome on its own.”
– John Williams 9/6/18
“The signal that you take from the yield curve now is different than it has been in the past…There’s reasons that the long end is depressed now for other reasons. In particular, there’s demand for safe assets, so flight to quality into the U.S. Treasury market, and also QE around the world. A lot of central banks have used the long end.”
– Loretta Mester 8/24/18
“Correlation does not imply causality. This is a particularly important point to keep in mind when discussing the yield curve. With this information in mind, I do not interpret that the yield curve indicates that the market believes the evolution of the economy will cause the FOMC to lower rates in the foreseeable future.”
– Raphael Bostic 8/23/18
“As we try to assess the implications of this flattening of the yield curve, it is important to take into account the very low level of the current 10-year yield by historical standards…Other things being equal, a smaller term premium will make the yield curve flatter by lowering the long end of the curve. With the term premium today very low by historical standards, this may temper somewhat the conclusions that we can draw from a pattern that we have seen historically in periods with a higher term premium. With a very low term premium, any given amount of monetary policy tightening will lead to an inversion sooner so that even a modest tightening that might not have led to an inversion in the past could do so today.”
– Lael Brainard 5/31/18
Fed Speak on the Yield Curve – Yeah, It’s a Thing
“Yield curve, for instance, is very flat, I’d rather not see an inverted yield curve in the US, that’s usually a harbinger of slow down ahead.”
– James Bullard 9/4/18
“I pledge to you I will not vote for anything that will knowingly invert the curve and I am hopeful that as we move forward I won’t be faced with that.”
– Raphael Bostic 8/20/18
“As I judge the pace at which we should be raising the federal funds rate, I will be carefully watching the U.S. Treasury yield curve…Overall, the shape of the curve suggests to me we are “late” in the economic cycle. I do not discount the significance of an inverted yield curve—I believe it is worth paying attention to given the high historical correlation between inversions and recession.”
– Robert Kaplan 8/21/18
This Week
Some second tier data, but otherwise a quiet week ahead of next week’s FOMC meeting. All eyes will be on the 10yr Treasury to see if we are poised for a dramatic move higher.


