

Last Week This Morning
- The 10T started and ended the week at 2.95%
- German bund fell from 0.57% to 0.54%
- 2 year Treasury inched up from 2.48% to 2.50%
- The yield curve has flattened to just 0.45%
- LIBOR climbed to 1.927%
- SOFR inched up to 1.74%
- Core PCE, the Fed’s preferred measure of inflation, increased from 1.6% to 1.9%
- This was the highest reading since January 2017
- The economy added 165k jobs last month, below the forecasted 195k
- Unemployment rate dropped to 3.9%, the lowest since 2000
- Average Hourly Earnings, considered an inflation indicator, came in slightly below expectations at 2.6%.
- The FOMC kept rates unchanged and suggested it would be comfortable with inflation running above 2% for a short time (we referred to this as price targeting last week)
- In fact, SF President Williams said he is “comfortable overshooting 2% inflation for a while”
Jobs Report
This was an interesting report. While the economy added 165k jobs, the consensus forecast was for closer to 200k. Would seem disappointing, right?
But Friday’s report was offset by an upward revision to the last two months of 30k. That brings the three month average to 208k and the twelve month average to 191k. Most economists believe the economy needs to add about 100k per month to just hold the unemployment rate steady as the population grows, so we are still well above that mark and the longer term trends seem strong.
Additionally, poor April weather could be to blame for the softer than expected data. Of the workers surveyed, 133k said they were unable to find work due to weather. That is nearly double the typical April survey of 75k.
Also, the BLS notes on its website that the monthly report can have a band of +/- 120,000 jobs. Over the last year, revisions have averaged a net decrease of 11k jobs.
The unemployment rate hit an 18 year low – 3.9%. But this was partially from a 240k drop in the labor force as the participation rate dipped slightly from 62.9% to 62.8%. The Fed’s own projections put the UR at 3.8% at the end of this year, so it will be interesting to see if they update those projections at the June meeting.
Most interestingly, average hourly earnings were a little soft at 2.6%. Average weekly earnings were down from 3.2% to 2.9%. How unemployment could have a 3-handle and still show little wage pressure is a conundrum.
Bottom line – nothing earth shattering about this report. The data is mostly strong, with some residual questions about wage pressures. Nothing in this report should effect the Fed’s policy positions.
FOMC Meeting – Symmetric 2.0% Objective
The Fed used a new word to describe its approach to inflation – symmetric. The Fed said inflation is expected to “run near the Committee’s symmetric 2% objective over the medium term.”
Last week we highlighted the possibility the Fed would transition away from an explicit goal of inflation holding precisely at 2.0% and instead switch to a price targeting approach. This approach, perhaps best described as inflation targeting with memory, attempts to make up for the recent undershooting of inflation.
Since we spent a decade with inflation below 2%, we should allow it to exceed 2.0% to compensate for that shortfall.
This should deemphasize the month to month inflation data since the Fed removed the reference to “monitoring inflation developments closely.”
It also gives the Fed some wiggle room to keep hiking rates even with inflation almost at 2.0%. This should reassure markets that if inflation pushes above 2.0% in the coming months, it should not necessarily be interpreted as the Fed needing to hike faster than expected.
This message was interpreted (correctly, we believe) that the Fed is not anxious to speed up the pace of hikes. The odds of a fourth hike in December didn’t really change (50%), but perhaps the risk of Fed Funds hitting some outlier landing spot (4%) have diminished.
Inflation – What Level Would Cause the Fed to Hike Faster Than Expected?
The Fed is suggesting it has some tolerance for inflation above 2.0%, but at what level would the Fed intervene and start hiking more aggressively?
The Fed has been beating a dead horse over the last year that inflation would eventually pop up again (they use the word “transitory” to describe the lack of inflation). Their patience appears vindicated. Core PCE came in at 1.9% last week and here’s how that compares to the last decade.
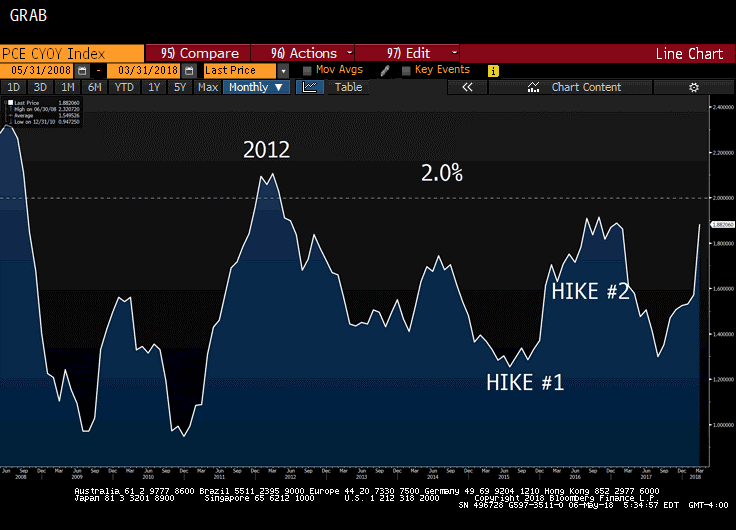
Source: Bloomberg Finance, LP
How the Fed interprets and responds to this will shape monetary policy over the next 18 months.
Look at this nice convergence between Core PCE (blue) and Fed Funds (white). It certainly appears as though the Fed is doing a good job of gliding us into a soft landing.
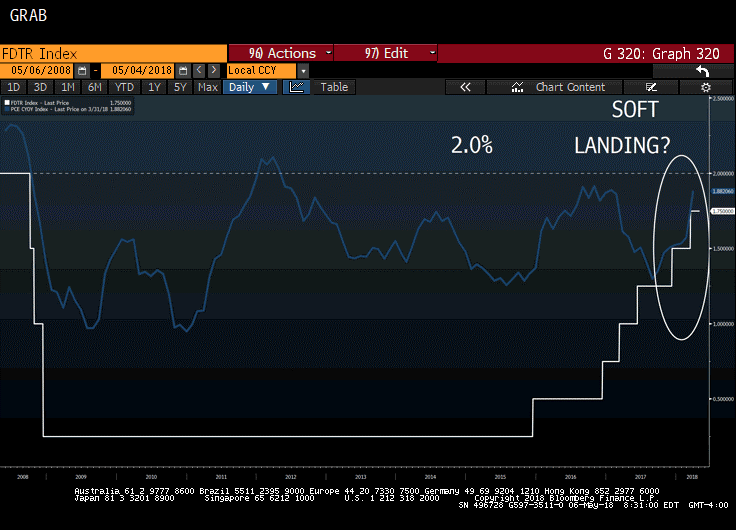
Source: Bloomberg Finance, LP
But over a longer period of time, the relationship between inflation and Fed Funds breaks down.
Over the last twenty years, Core PCE has traded within a pretty tight band: 0.9% – 2.50%.
Over the same time period, Fed Funds experienced a much wider band: 0.25% – 6.50%.
It seems as though there’s no easily identifiable correlation between Fed Funds and inflation.
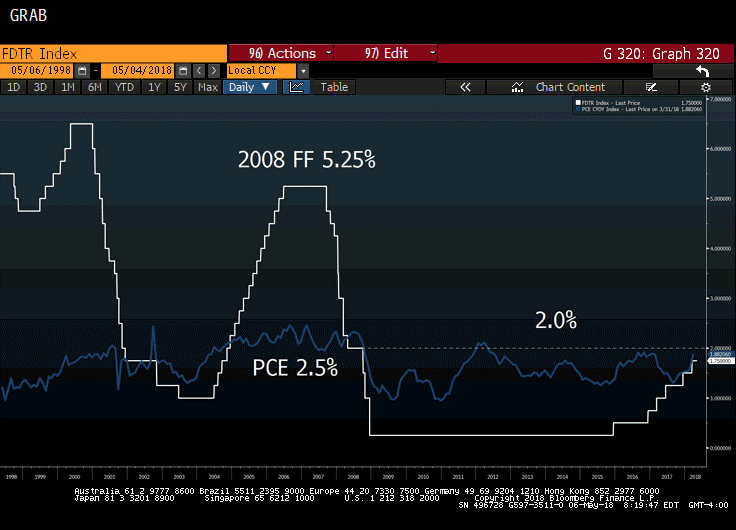
Source: Bloomberg Finance, LP
Bottom Line – The twenty year inflation peak of 2.50% probably represents a good ballpark estimation for what threshold would make the FOMC intervene more aggressively.
- If inflation hovers around 2.0% and occasionally ticks up to 2.1% or 2.2%, we wouldn’t expect the Fed to change its current path of hikes and the final landing spot of Fed Funds around 3.0%.
- If inflation appears to be pushing towards 2.50%, then we would expect some sort of revision to the pace of hikes and final landing spot somewhere above 3.0%.
Treasury Yields
Absent bad news, we continue to believe there’s a chance the 10 year Treasury will break through 3.05% in the coming months.
The Treasury announced an increase to upcoming auction sizes, which coupled with continued balance sheet normalization should also apply some upward pressure on yields. The Fed’s slightly dovish bent last week should also help give the long end of the curve to move up.
But if we are wrong, yield curve flatness should garner more attention. The spread between the 10 year Treasury and the 2 year Treasury fell to just 0.45% – the lowest since 2008.
But 2008 probably isn’t representative of where we stand today because the yield curve was actually steepening as a result of the Fed slashing rates and the T10 didn’t keep pace.
A better comparison is probably 2004 when the Fed was hiking rates and the T10 didn’t keep pace. The curve inverted in 2005 and we had a recession two years later.
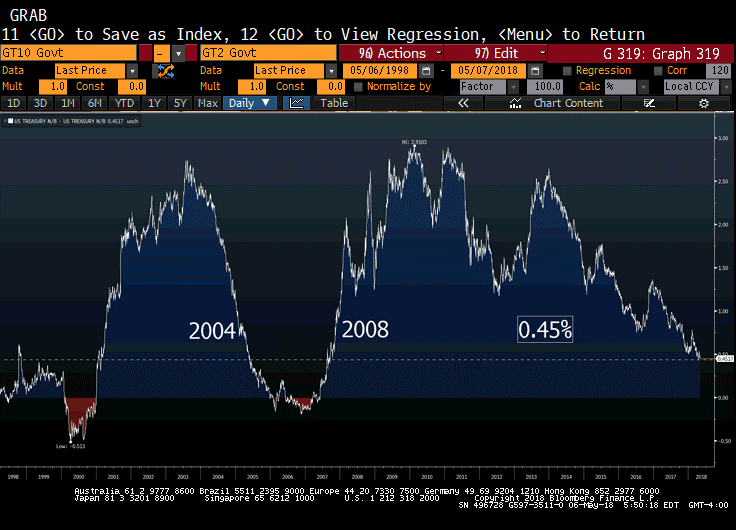
Source: Bloomberg Finance, LP
This Week
Quieter week ahead. Inflation data due out Wednesday and Thursday, but not as significant as last week’s Core PCE.
More importantly will be Fed-speakers as they attempt to massage the Fed’s interpretation of last week’s meeting.